Overview
The data and analytics space is booming and changing how we analyze and use data across industries.
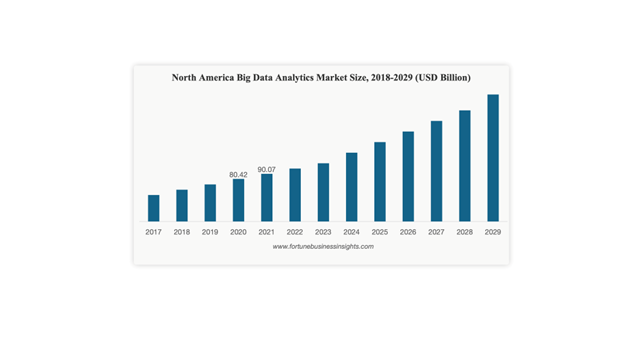
According to Fortune Business Insights, the global big data analytics market is projected to grow from $271.83 billion in 2022 to $655.53 billion by 2029 (at a CAGR of 13.4%).
Source: Fortune Business Insights

This boom has only been further accelerated by the recent pandemic as industries are shifting to digital solutions to address expanded market opportunities.
Digital transformations, Artificial Intelligence (AI), the Industrial Internet of Things (IIoT), and similar technological trends are only accelerating data generation. Illustratively,the International Data Corporation (IDC)predicts that there will be 55.9 billion connected devices by 2025, generating 79.4 ZB of data.
This is also why companies that monetize their data – Google, Amazon, Uber, and others – are among the most valuable in the world (both in terms of market capitalization and innovation).
After all, a successful data strategy can increase revenues, optimize operational costs, reduce time to market, enable new products, and importantly, optimize the Customer Experience (CX).
But how can you harvest the power of data and analytics for your organization? A good starting point is understanding the breakdown of the type of data available to you.
What is Quantitative Versus Qualitative Data?
Quantitative data refers to data that can be counted, measured, or assigned a numerical value.
Quantitative variables answer questions such as “how many” or how frequently.” In terms of Customer Experience (CX) data, quantitative data would measure click-through rates, bounce rates, or time-on-site rates. The most common form of analysis for quantitative data is statistics: it collects, models, and presents larger amounts of data to infer patterns.

On the other hand, qualitative data refers to descriptive data.
Qualitative variables answer questions like “why” or “how.” Qualitative data would typically be collected through research interviews, focus groups, or observations.
Source: GeoPoll
Both types of data come with significant advantages and disadvantages.
For example, quantitative data tends to be more straightforward and less prone to subjectivity or errors. But on the flip side, a quantitative approach cannot tell you the full story and thus could be inconclusive or overlook broader patterns.
Meanwhile, qualitative data provides contextual, predictive, and in-depth insights. But it is not always statistically representative and can be biased based on the host, respondents, questions, and other variables.
Hence, for a complete analysis, using both quantitative and qualitative data yields optimal results.
The Top 3 Data Applications to Drive Your CX
Using an optimized mix of quantitative and qualitative data is particularly powerful in optimizing your CX.
While there are many applicable use cases, there are three that should serve as every organization’s building blocks regardless of its product, service, industry, or market.
1. Optimize Your User Research to Inform All Of Your CX Decisions
Regardless of what product or initiative you’re working on, optimizing your user research process will be critical to your success.
Excellent user research doesn’t just help you organize a test or redesign a website. It helps you segment your target customers, prioritize items on your roadmap, and even inform your blog posts.
And user research leverages a combination of quantitative and qualitative data. Use a combination of web analytics, online and offline focus groups, 1-on-1 interviews, real-time user feedback and text analytics to dive deep into key behavioral drivers.
2. Use Customer Behavior Data to Drive Revenue
According to McKinsey, organizations that leverage customer behavior data to generate behavioral insights outperform peers by 85% in sales growth and more than 25% in gross margin.
And there are 3 key ways to drive business impact with customer behavior analytics.
- In customer acquisition: journey orchestration software helps optimize personalization decisions across touchpoints and ensures that every message reflects every customer’s overall experience with the organization and the goal.
- In customer retention: you can spot red flags through a customer’s behaviors and, with proper analytics, make sure signs of trouble are acted upon early.
- In customer growth and expansion: you can use data to drive cross-sell, up-sell or repeat purchases.
Perhaps the strongest example is Amazon’s recommendation algorithm. It is supported by customer behavior data such as a user’s purchase history or items they’ve liked. As such, it drives 33% of the firm’s revenue.
3. Leverage Observability to Power Business Transformation
According to VMware, 89% of respondents agree that today’s technology applications are significantly more complex. 97% report challenges in their ability to monitor cloud application environments, with visibility and insight issues growing from last year.
Companies have been monitoring application performance for almost as long as we’ve had applications. But new trends (hybrid infrastructure, microservices, edge computing, etc.) make it difficult for traditional tools to keep up. And observability bridges this gap, bringing advanced analytics – both quantitative and qualitative – to applications running in a variety of modern environments.
While monitoring only collects the data from the system and alerts you to something is wrong, observability goes beyond monitoring to interpret the data. Observability helps provide answers about why something is wrong and how to fix it, allowing teams to pinpoint the root cause, minimize downtime, and increase operational efficiency.
And as companies move to modern observability platforms, they start to see the benefits in performance and availability. These benefits further accelerate as companies move along the maturity curve.
How Germain UX Can Help With Your Observability Needs
Germain UX is an end-to-end, GLDP-compliant application performance management, monitoring, observability, analytics, and automation software platform built to improve User Experience in the broadest sense of the term (e.g. User behaviors, Workflows, etc).
Depth of insights is key and provided at Behavioral, Process and Technology levels. Real User Recording and Replay offers millisecond precision, so it records everything a User “sees” and “does”. Yet Germain UX is GDPR compliant so that data privacy is respected at all times.
Germain UX is very customizable, so your organization can scale and always count on it to deliver the analytics and automations your organization needs. It can be configured in any way you want to monitor and manage the performance of your software and hardware, analyze user experience in real time, predict issues, and automate transactions to proactively resolve issues.
It works best if given access to your entire infrastructure and can be deployed on-premise, on your cloud, or our cloud. Get in touch with our team if you’re interested in learning more.
Conclusion
Regardless of the massive opportunities ahead, most organizations have yet to successfully monetize data, which will take a proactive strategy, investment, key talent, and other conducive strategies.
According to HBR, cross-industry studies show that less than half of an organization’s structured data is actively used in making decisions—and less than 1% of its unstructured data is analyzed or used at all. Furthermore, more than 70% of employees have access to data they should not, and 80% of analysts’ time is spent simply discovering and preparing data.
Thus, much more work remains to be done. Plus, a successful data strategy will have to be fully customized to an organization based on data availability, strategy, market, product or service, and much more.
Illustratively, Gartner highlighted how data strategies can differ across organizations and markets, but yet emerge with similar success stories.
For example, Dow Chemical started with a significant data problem. The organization had hundreds of dashboards and thousands of reports, but none of that information was generating better decisions. So Dow Chemical reviewed usage metrics and used that feedback to identify and solve unresolved user obstacles. The result? The platform’s consumption increased by 25% while the business value of Dow’s enterprise analytics and BI solutions grew by 4.2x.
Similarly, Turku City Data’s created an analytics framework that organized all data at a level of abstraction (such that every data point represented a person, object, location, or event). The company used this frame as a common language to explore business problems in their contextual and structural richness.
Lastly, instead of looking at data they already had, the ZF Group selected markets to target and took a close look at what type of data would create value for that market. They then created data that did not previously exist.
And those are just a few success examples for inspiration to get your organization started on its data and analytics journey.