Monitoring For Java.
Effective Java Code Performance, 24×7.
- Java Code runs fine for some users – but not for others.
- Java Code runs fine on a test – but not on production.
- Haven’t touched that part of the Java Code for a while, why is it failing or slower now?
- If I can’t reproduce a problem, how do I validate a fix?
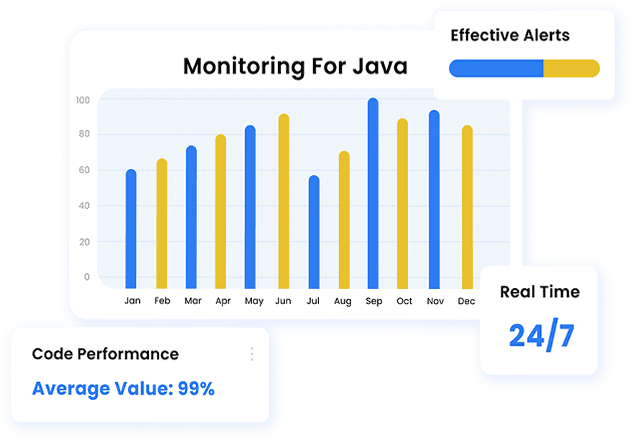
Powerful Features & Capabilities for Java Code Optimization.
End-to-end Metrics.
- Browser Freezes.
- Container Issues.
- CPU Cycles.
- Crashes and Exceptions.
- Integration Failures.
- Memory allocation.
- Network Contention.
- Queries.
- Sessions.
- Threading.
- And more…
Learn about Germain’s real-time java monitoring and code profiling.
Effective Root-cause Analysis.
Learn more about Correlation and Tracing and Exception Automated Analysis.
Smart Insights and Alerts.
Learn about smart insights and actionable alerts.
Save time reproducing an issue!
Days, weeks, and sometimes months are needed to understand how to reproduce an issue, such as an application crash, an error, or a slow page. Let Germain capture the complete user experience and help you understand what actions lead to an issue using session replay.
Learn more about Germain’s millisecond and pixel-perfect real user monitoring and session replay.
The Germain Advantage

Optimize Legacy and Cloud Apps.

Impact Analysis @ scale.
Learn how to quickly quantify user impact at scale on an aggregate or drillthrough dashboard.

100% searchable.
Learn more about search and filters.

Very customizable.
How many times does your organization hit a roadblock with a tool and search for another tool? At Germain, we believe that all real-time monitoring, analytics and automation should be delivered by a single platform and that starts by having a platform that is very customizable, from what data it collects, where, how it analyzes, what automation it applies to it, how it visualizes it, alert on it, and report it, etc

Exceptional Support.
Don’t believe us? Just try our platform for 60 days and see how we support you!

