When it comes to troubleshooting user issues (experienced with your web apps), you have the option to ask your end-users to use Google Chrome Developer console and get more details on javascript execution/failure, static content loading issue, network disconnectivity, etc. (with the issue that this Google Chrome console is NOT going to pinpoint issues that are caused by some application, database or other infrastructure pieces running in the backend data center or cloud…yet these end-users have very likely something else more important to do than troubleshooting these issues: their jobs! or you can also use germainAPM and all the monitoring pieces that it consists. One of the monitoring piece is a Chrome Extension that will help you deep-dive into the actual javascript, static content and other network traffic processed by the end-user browser, all this germainAPM will get it to you in real-time.
Here are some best-practices on how to monitor in real-time, the browser-specific insights that help identify the javascript at the root-cause of a end-user issue:
1. Performance API to collect resource URLs… (rather than scanning and tracking changes to the DOM for them)
2. DOM only when it makes sense
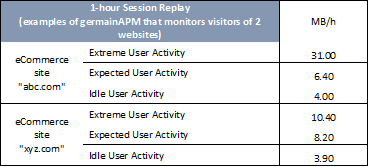
3. Assess/Reduce the impact (response, memory and network traffic). Here is an idea of how much data is stored within germainAPM database while monitoring an eCommerce site that has 1000 concurrent users and depending on how heavily these users browse the eCommerce site:

4. Asynchronous Transaction as much as possible
5. Away from the Main Thread whenever possible
6. And focus on providing metrics that will help your developers understand and fix issues, such as:
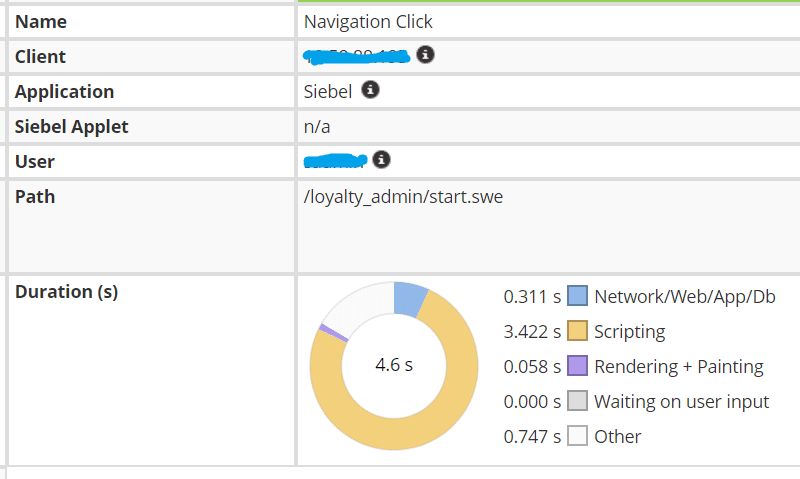
Breakdown the user click response to understand how much time is spent on the browser, network, infrastructure and application.
i.e. collect in real-time: User Click, Move, Page response time are broken down and includes the following:
Network Time/Server Time (code analysis)/Database time(sql, etc)
Scripting time
Rendering & Painting time
Waiting on User input
Other time
Then deep dive within the transaction, at the browser, network, application code, integration and database sql (…) levels
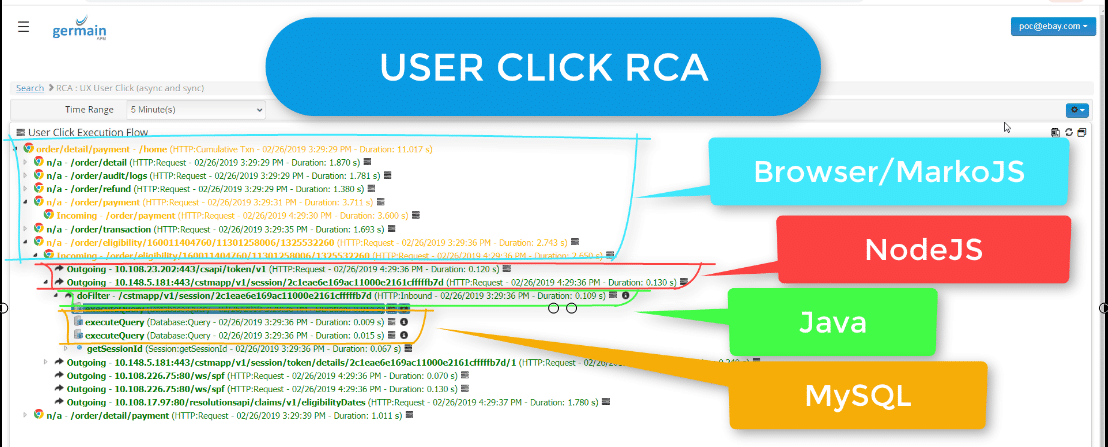
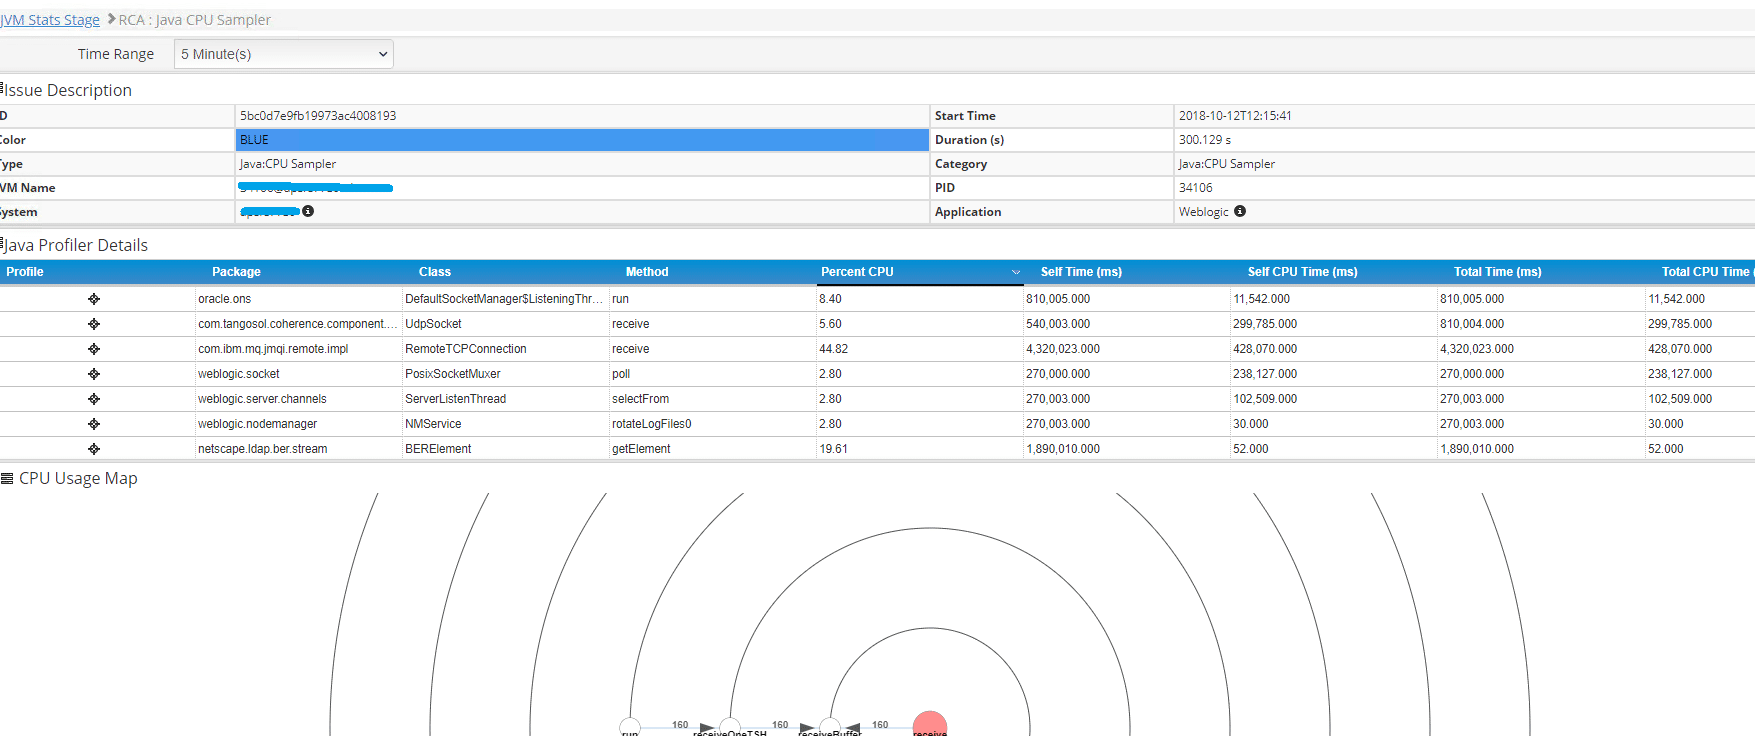
at the java/jvm process and code level:
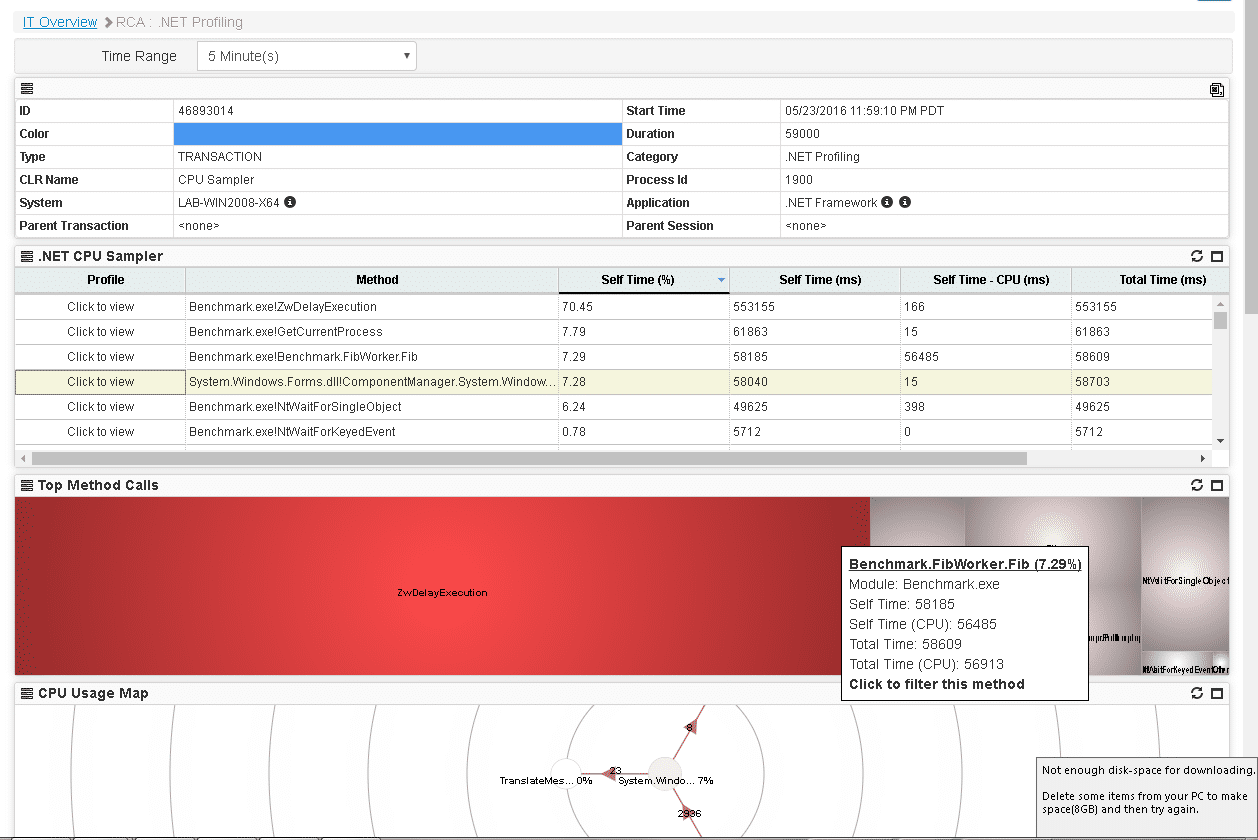
or within the .net/clr process,…:
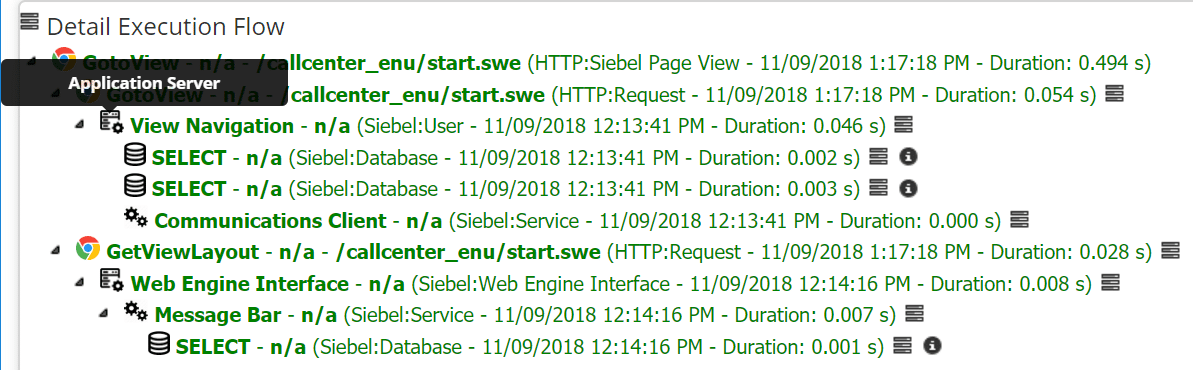
or within your heavily customized CRM or ERP applications and the transactions that got executed: