cross-browser, no extensions or other installation, no interruption of end-user’s experience
Built-in Profilers
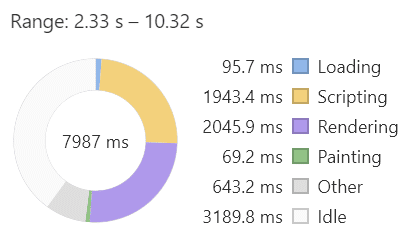
The profiling functionality offered in most web browsers can be used to understand where the largest performance bottlenecks are, but they have to be triggered by the end user and therefore that data will only be available to those with access to the specific machine some time after it becomes known that there is an issue to investigate. From this perspective, the goal is to be able to display a breakdown of time spent in script, rendering/painting, and waiting on network requests, similar to what the Chrome profiler provides, but using only data that a Web Application can log for itself by using an extra bit of script.

A screenshot of the donut chart in Chrome’s profiler
JavaScript
For various reasons, web browsers do not expose the internals of a page’s runtime behavior to JavaScript, and there is no API to interface with the builtin profiler. That being said, it is still possible to make headway towards a web application taking these measurements for itself, which is a testament to the flexibility of JavaScript.
There are a wide variety of catalysts that can trigger work within the browser. The Chrome browser refers to these as “activities”. The following table from the profiler includes the vast majority of activity types.
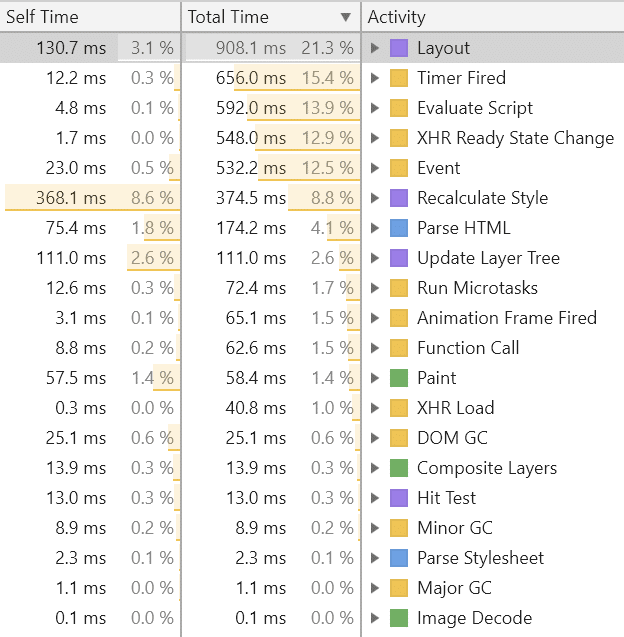
In this article we focus on only the activities that cause the web application’s own script to run. We categorize them into the following five groups based on the different challenges they pose with respect to instrumentation:
1. Initial evaluation: Evaluate Script
2. Time-driven callbacks: Timer Fired, Fire Idle Callback, Animation Frame Fired
3. Event-driven callbacks: Event, Run Microtasks, XHR Ready State Change, XHR Load
4. Incidental: Major GC, Minor GC, DOM GC, Parse HTML, Parse Stylesheet, Recalculate Style, Layout, Hit Test
5. Display: Update Layer Tree, Paint, Composite Layers, Image Decode
Only categories 2 and 3 can be directly instrumented. Incidental activities (4) can get triggered at semi-unpredictable times as a side-effect of other script, and cause that other script to take longer to complete. Initial evaluation (1) and display (5) activities can only be measured indirectly using some tricky heuristics. The heuristics for measuring the time spent in display activities, and purple and green categories in general, are outside the scope of this article.
Any root-level occurrences of Function Call are a bit of an outlier, they typically only occur outside of the context of any other activity when the browser is calling into an extension the end-user may have installed. Browser-extension callbacks are also not able to be instrumented by script.
Instrumenting Callbacks
For the activity types that are callback-based, each has a registration function to setup a callback into some custom script at a future time or event – e.g. addEventListener, setTimeout, requestIdleCallback, etc. These registration functions can be replaced with instrumentation code, which adds timestamps to each future call to the callback. This instrumentation is only taking place at the base of the callstacks, so the overhead, per callstack, is a negligible constant factor.
Many details have to be taken into consideration in the instrumentation, such as:
● letting unhandled exceptions through without interrupting time measurements
● ensuring that calls to removeEventListener get passed the identical function that was passed to addEventListener
● in order to not break some client code, properties of the registration function may need to be mimicked in the instrumentation version, such as name, length, prototype, constructor, toString value, etc.
● using the ‘new’ operator when the callback is an object constructor and cannot be called as a function
● setTimeout and setInterval can be called with a string (of code) instead of a function
● event callbacks can also be registered through assignments to .onclick, .onload, etc.
● event callbacks can also be registered through Element attributes “onclick”, “onload”, etc. whether procedurally or as HTML
Heuristics for Initial Evaluation
The content of script tags is evaluated as part of the process of being added to the DOM. There are a few variants of that, the most fundamental being the parsing of HTML. DOM mutation events are fired for each Element parsed, but script content is only executed at that time if not marked as ‘async’ or ‘defer’. Script Elements may also by added programmatically as part of the evaluation of other script, or later during callbacks. The text content or ‘src’ attribute of a script Element may also change procedurally, which can cause additional script evaluation in certain cases. Each of these variations and their combinations require their own heuristics, as there is no direct way to instrument timings for the initial evaluation of scripts.
Germain UX
Our application performance monitoring product, Germain UX, includes an implementation of measuring script, render/paint, and network time as part of its UX monitoring suite. For any web application, it tracks the total time spent in each of those categories for each meaningful interval of activity between the application and its web services, such as a page navigation or batch of asynchronous transactions. The presentation is designed to closely resemble the donut chart in Chrome though the categories are slightly different.
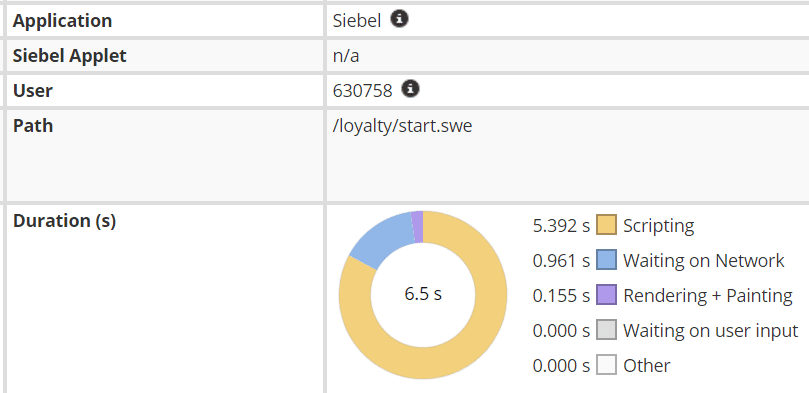
A screenshot from Germain UX
In summary, we can report, with the above-stated caveats:
● the total or proportion of time spent executing script over some interval
● the start and end times of each execution interval or “activity”
● total script time spent per script file
● periods during which the main thread was hung/non-responsive