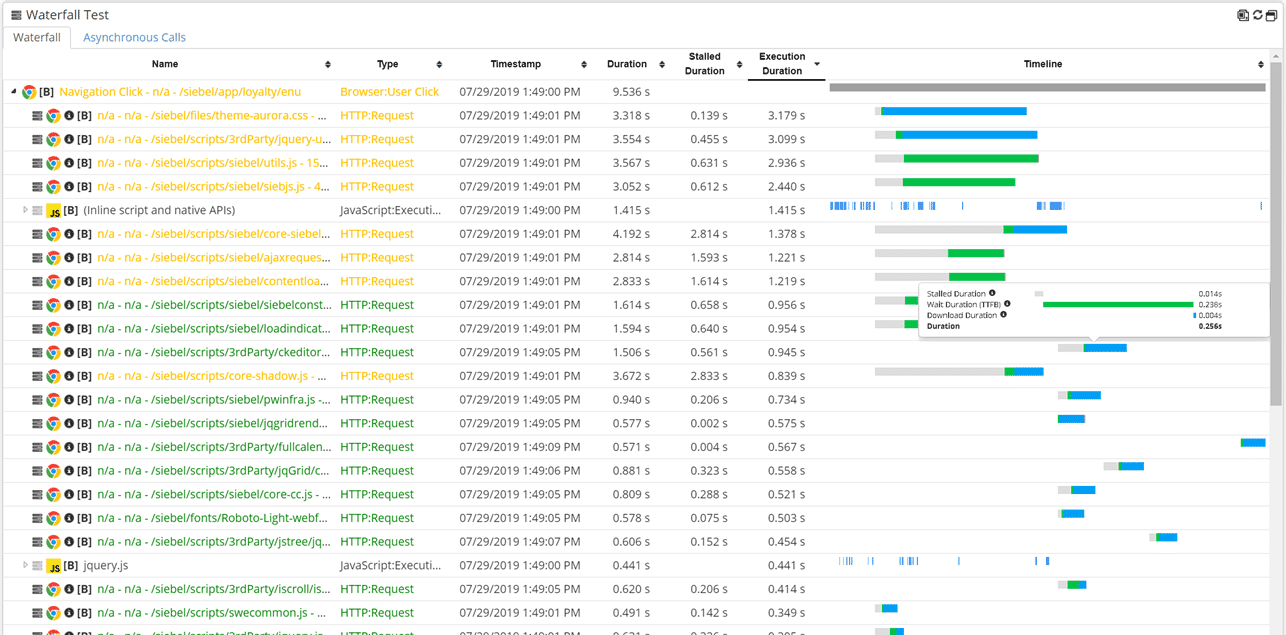
Real-time performance monitoring and analysis of Javascript execution, down to the line of code, for any web application built with any javascript framework (AngularJS, ReactJS, VueJS, etc). That feature completes the end-to-end time breakdown of a user click (>java script>network request>web request>application code>database sql,…levels and any integration layers)
Metrics
Any metric that Google Chrome provides, including:
- Javascript method execution time
- Javascript line (of code) execution time
- Stall duration
- Download duration
- Wait duration
- etc
Examples
For a REACT app:
For a SALESFORCE.COM saas solution:

Deep dive into the execution of javascript (using germainAPM’s browser extension)

and some insights on whether this is stall, connection, wait, download ,etc
Supported Technologies
- Any html
- Any Javascript (AngularJS, ReactJS, VueJS, etc)
Reminder:
That end-to-end analysis of a user click or transaction, is configurable, so you can further define data relationship and can include any data sources e.g. this above RCA dashboard can include any transaction from the ones executed in the Browser (javascript, etc), Network (http, etc), Back-end Applications (web server, application code, database SQL, CTI, etc), making very handy to understand the end-to-end executions of a user click or complex transaction.
Download germainAPM Javascript (for UX monitoring and User Issue analysis e.g. click duration breakdown)
Download germainAPM Chrome Extension (for real-time deep dive into the execution of your javascripts)
https://chrome.google.com/webstore/detail/javascript-profiler-germa/cjffkpkljodmdajjbkcjeflmmhnackij


