Every developer has seen this scene: a user clicks a button, nothing happens, they click again—still nothing—and by the third frustrated tap, three overlapping modals explode onto the screen. The page wasn’t slow to load. It was slow to respond. This highlights the importance of perceived performance—how fast and responsive a website feels to users—which can shape user satisfaction regardless of actual load times.
This is the performance problem that actually breaks user experience, yet it’s the one teams most often ignore. Poor performance, such as slow responsiveness, leads to frustration and can drive users away. We obsess over page load times, celebrate shaving 200ms off Time to First Byte, and pat ourselves on the back when Lighthouse scores turn green. Meanwhile, our users are rage-clicking through interfaces that feel sluggish, unresponsive, and fundamentally broken.
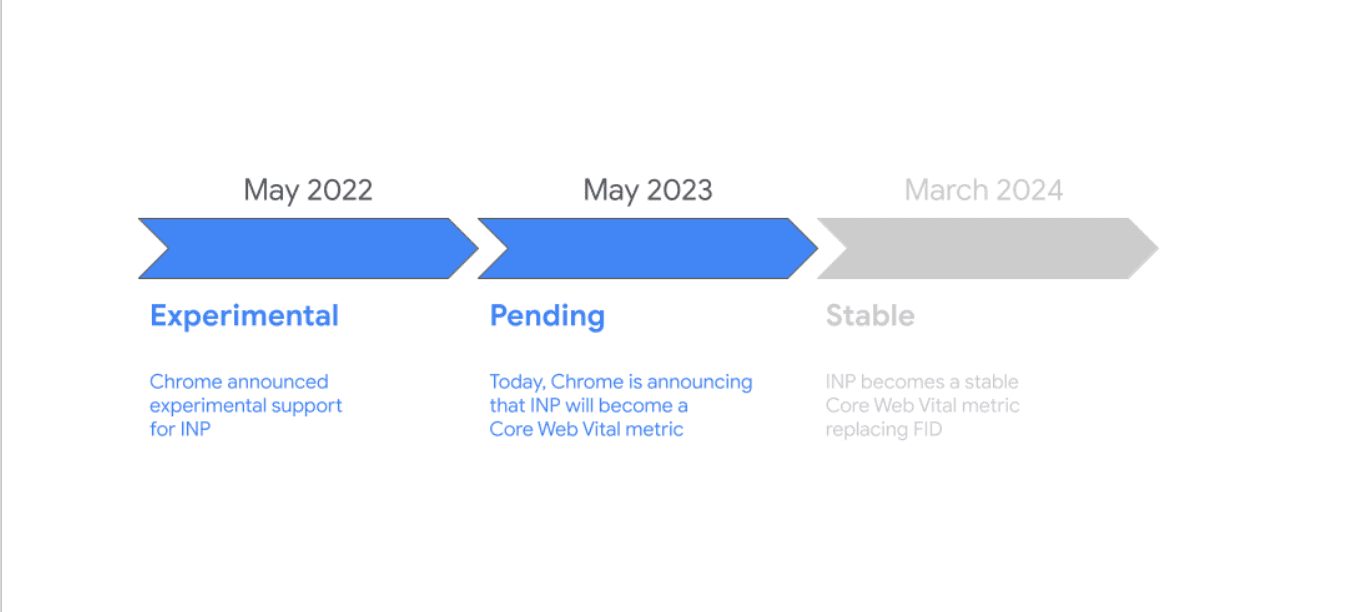
Enter Interaction to Next Paint (INP)—the Core Web Vital that Google promoted from experimental status to replace First Input Delay in 2024. Unlike its predecessor, INP doesn’t just measure the first click. It captures the full distribution of interaction latency throughout a user’s session, exposing the responsiveness friction that makes interfaces feel janky even when they load fast. Users today have high user expectations for instant feedback and seamless interactions, making fast and responsive interfaces essential.
The brilliant part? INP isn’t a vague aspiration like “make it feel faster.” It’s a practical, measurable KPI that directly maps to engineering work you can control. Optimizing for INP helps deliver positive user experiences by ensuring your site responds quickly and reliably to user input.
Why cumulative layout shift breaks responsiveness (and why you didn’t notice)
Traditional performance metrics miss responsiveness problems because they focus on the wrong thing. Metrics like First Contentful Paint tell you when pixels appear, First Paint marks the first visual change, DOM Content Loaded (DCL) indicates when the initial HTML document has been fully loaded and parsed, and Largest Contentful Paint (LCP) measures when the biggest element renders and becomes visible in the viewport. These matter, but they’re passive metrics. Users don’t just watch pages—they interact with them.
The gap between user action and visual feedback is where experience collapses. When someone clicks a button, their brain expects instant acknowledgment. Research shows that delays beyond 100ms feel sluggish; anything past 200ms feels broken. Yet the median website has interactions that take 300-500ms to produce visible results, with p75 latencies frequently exceeding one second. The speed of initial rendering and how quickly page content becomes visible are crucial for perceived performance.
Why? Because the main thread is busy.
Modern web applications are single-threaded execution environments doing far too much work: parsing massive JavaScript bundles, running analytics tags, hydrating React components, processing form validation, executing third-party tracking pixels, and loading external resources like third-party scripts, images, and stylesheets. These external resources can increase HTTP requests and delay responsiveness. When a user clicks during this chaos, their interaction joins a queue behind everything else. The button press waits. The user notices. Trust erodes. The user’s device and user’s browser also play a significant role in determining how quickly the page responds, as their processing power and efficiency impact overall responsiveness.
First Input Delay tried to measure this but only captured the first interaction—a metric easily gamed by optimizing initial page load while leaving the rest of the experience sluggish. INP fixes this by measuring interaction latency across the entire session and reporting the 75th percentile. If your worst interactions are bad, your INP score is bad. No hiding.
It’s also important to note the difference between when a page is ready for interaction and when it is completely loaded. The load event fires when all resources, including stylesheets, scripts, iframes, and images, have finished loading, but the page may be interactive before it is fully loaded. A well-organized page structure and efficient script loading can help the browser parse the HTML quickly, improving DOM Content Loaded timing and enhancing interactivity.
INP as a north-star metric: from vague goal to user input engineering KPI
The power of INP lies in its specificity. “Make the site faster” is useless guidance. “Reduce INP from 450ms to under 200ms” is a concrete goal with measurable outcomes.
More importantly, INP creates accountability. Unlike subjective UX complaints (“the interface feels laggy”), INP gives you a number tied to real user sessions. When that number climbs, something in your codebase changed. When it drops, your optimizations worked. This makes performance engineering a continuous practice rather than a pre-launch panic.
Here’s the practical loop:
1. Detect worst interactionsUse Real User Monitoring (RUM) or tools like Chrome’s web-vitals library to capture INP scores in production. Don’t just look at the aggregate—segment by page type, device, geography, and user flow. Your checkout page might have great INP while your dashboard is a disaster.
When segmenting INP data, also consider user engagement metrics such as average session duration to understand how performance impacts user behavior and retention.
Focus on p75 and p90 data. These reveal where most users actually suffer, not just the ideal conditions of your development machine.
2. Tie latency to UI bottlenecksINP breaks down into three phases: input delay (time before event handler starts), processing time (event handler execution), and presentation delay (time to paint the next frame). Your job is to figure out which phase is the problem.
Long input delay? The main thread was blocked when the user clicked—likely by third-party scripts, large JavaScript bundles, or expensive layout recalculations. Use total blocking time measures to quantify how much blocking is occurring and its impact on interactivity.
Long processing time? Your event handlers are doing too much synchronous work—heavy state updates, complex calculations, or poorly optimized DOM manipulation.
Long presentation delay? Rendering is expensive—oversized component trees, forced reflows, or inefficient CSS.
Chrome DevTools Performance panel and the Long Tasks API make these bottlenecks visible. Record a session, find the sluggish interaction, and trace exactly what blocked the thread.
3. Ship fixes that target root causesGeneric performance advice (“use code splitting!”) doesn’t help if you don’t know what’s actually slow. Once you’ve identified the bottleneck, apply surgical fixes:
Break up long tasks: If JavaScript execution exceeds 50ms, yield to the browser using setTimeout, scheduler.yield(), or React’s startTransition.
Defer non-critical work: Analytics, A/B testing, and social media widgets don’t need to run before the user can click buttons. Load them asynchronously or delay initialization until after key interactions.
Optimize event handlers: Move heavy computation to Web Workers. Debounce expensive operations. Use event delegation instead of attaching hundreds of individual listeners.
Reduce render complexity: Virtualize long lists. Avoid layout thrashing. Minimize React re-renders with useMemo and React.memo.
When testing and monitoring, use interactive measures like Time to Interactive (TTI) and tools that simulate user interactions to identify bottlenecks and ensure the site is responsive under real-world conditions.
4. Verify INP impactDeploy your changes. Wait for real-world data. Check if INP improved. If not, you fixed the wrong thing—go back to step two.
In your monitoring and measurement process, track your performance score using tools like PageSpeed Insights, and make sure you are looking at all the metrics—including INP, TTI, total blocking time, and user engagement metrics—for a comprehensive view of web performance.
When discussing the impact of performance improvements, remember to connect them to business metrics such as conversion rate, as optimizing web performance metrics can directly influence user actions and overall business outcomes.
This loop transforms performance from a guessing game into a feedback-driven process. You’re not throwing optimizations at the wall; you’re solving specific, measured problems.
Real-world impact: real user responsiveness is retention
Google’s research on Core Web Vitals shows that pages with good INP (under 200ms) have 24% lower bounce rates than those with poor INP (over 500ms). For e-commerce sites, every 100ms of interaction delay correlates with a measurable drop in conversion rates. The speed at which the largest content element becomes visible (LCP) also directly impacts user engagement and conversion rates.
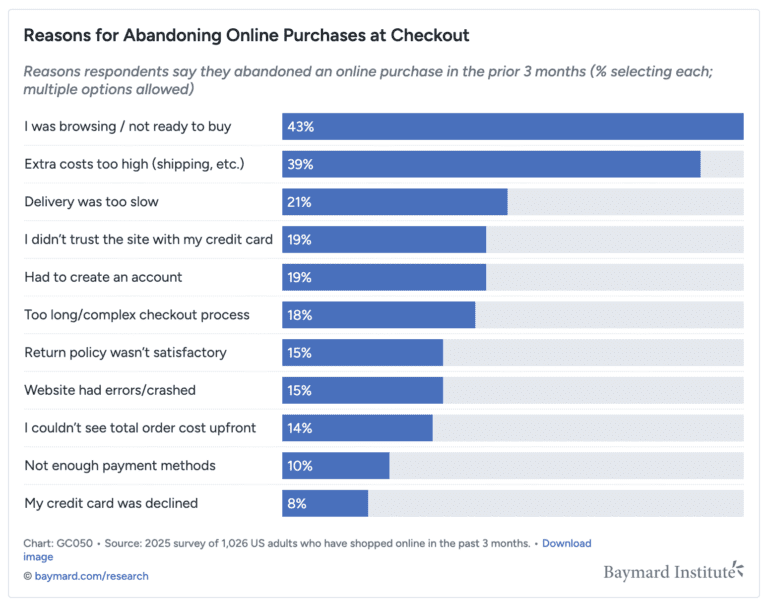
This isn’t theoretical. Users abandon forms that don’t respond instantly. They mistrust interfaces that lag between click and feedback, and unexpected layout shifts that harm visual stability can erode user trust. They leave experiences that feel broken—even if your page loaded in two seconds. Users care deeply about load speed as a key factor in their experience.
The companies winning on user experience aren’t chasing vanity metrics. They’re instrumenting INP, treating it as a KPI that engineering owns, and building continuous optimization into their workflow. Technical optimizations like improving cache hit ratio and aiming for a higher cache hit ratio can further enhance content delivery speed and overall user experience.
Stop chasing “page speed.” Start controlling performance metrics and responsiveness.
Performance isn’t just about how fast your page loads. It’s about how quickly your interface responds when users try to use it, starting from the initial load and throughout the entire load timeline.
INP gives you a clear, measurable way to track this. It exposes the responsiveness friction that traditional metrics miss. It ties directly to engineering work you can control: reducing main-thread work, optimizing event handlers, deferring non-critical scripts, breaking up long tasks, and improving caching strategies, server response times, and server responsiveness.
The next time someone says “make the site faster,” ask them what they actually mean. If they mean “improve user experience,” the answer isn’t just shaving milliseconds off TTFB. It’s making sure that when users click, tap, or type, the interface responds instantly—every time. This includes optimizing how quickly content is rendered, such as background images, which can significantly impact perceived speed.
Measure INP. Find the bottlenecks. Fix them. Repeat. And don’t forget to monitor other key web performance metrics like Largest Contentful Paint (LCP), which measures how quickly the largest element—often an image, video, or text block—becomes visible to users.
That’s how you turn UX friction into an engineering-controlled KPI.
Web Performance Tools and Monitoring
Delivering a fast, responsive website isn’t just about writing good code—it’s about knowing exactly where your site stands and what’s holding it back. That’s where web performance tools and monitoring come in. They turn vague suspicions about “slowness” into concrete, actionable data, helping you zero in on the real issues affecting user experience.
A host of tools are available to help you measure and optimize website performance metrics. Google PageSpeed Insights, WebPageTest, and Lighthouse are industry standards, providing deep insights into everything from page loads and input delay to user interaction and cumulative layout shift. These tools break down the loading process, highlight performance bottlenecks, and offer clear recommendations for web performance optimization.
But synthetic tests only tell part of the story. Real user monitoring (RUM) takes things further by capturing data from actual user experiences in the wild. RUM tracks how real users interact with your web page, measuring metrics like cumulative layout shift (CLS), first contentful paint (FCP), and interaction to next paint (INP) as they happen in the user’s browser. This real-world data reveals how performance issues—like unexpected layout shifts or sluggish input response—impact user engagement and conversion rates.
Core Web Vitals—CLS, FCP, and INP—are at the heart of modern website performance metrics. These core metrics focus on what users actually feel: how quickly content appears, how stable the page layout is, and how fast the interface responds to user input. Google uses these metrics to inform search engine rankings, making them essential not just for user satisfaction but for visibility and business growth.
To get a complete picture, combine synthetic testing (which simulates user interactions and measures load time, speed index, and resource delivery under controlled conditions) with RUM (which captures actual user experiences, device types, and network conditions). This dual approach helps you identify both predictable performance bottlenecks and those that only surface in real-world scenarios.
Optimizing web performance means attacking issues from multiple angles. Compress and optimize images, minify CSS and JavaScript, leverage browser caching, and eliminate unnecessary resources that bloat page weight. Content delivery networks (CDNs) can dramatically reduce network latency and improve resource delivery, ensuring your site loads quickly no matter where your users are. Every millisecond you save on input delay or resource loading translates to a smoother, more engaging experience.