Troubleshoot Javascript (in real-time)
Javascript execution analysis on dev environments is easy—just use Google Developer or some other free tools. However, getting the same level of analysis while your application is being used by a real user is much harder.
You can’t possibly ask the end-user to help you troubleshoot. Even if you did, the user probably wouldn’t know what to do and they definitely wouldn’t be impressed by your organization.
So, how do you analyze and solve poor user experience issues without reaching out to the end-users? Two solutions you will need to deploy: germainAPM’s JS (that will give you all the UX-level insights and help you understand which part of the application and/or infrastructure is at the root-cause of the UX issue) and germainAPM’s Browser Extension (that will help you analyze the line-by-line execution of your javascript).
These two solutions work for any web app—on desktop or mobile—and they work no matter if you’ve built with AngularJS app, ReactJS app, Salesforce.com, Shopify, or some other Siebel CRM.
Metrics
Any metric that Google Chrome provides, including:
- Javascript method execution time
- Javascript line (of code) execution time
- Stall duration
- Download duration
- Wait duration
- etc
Examples
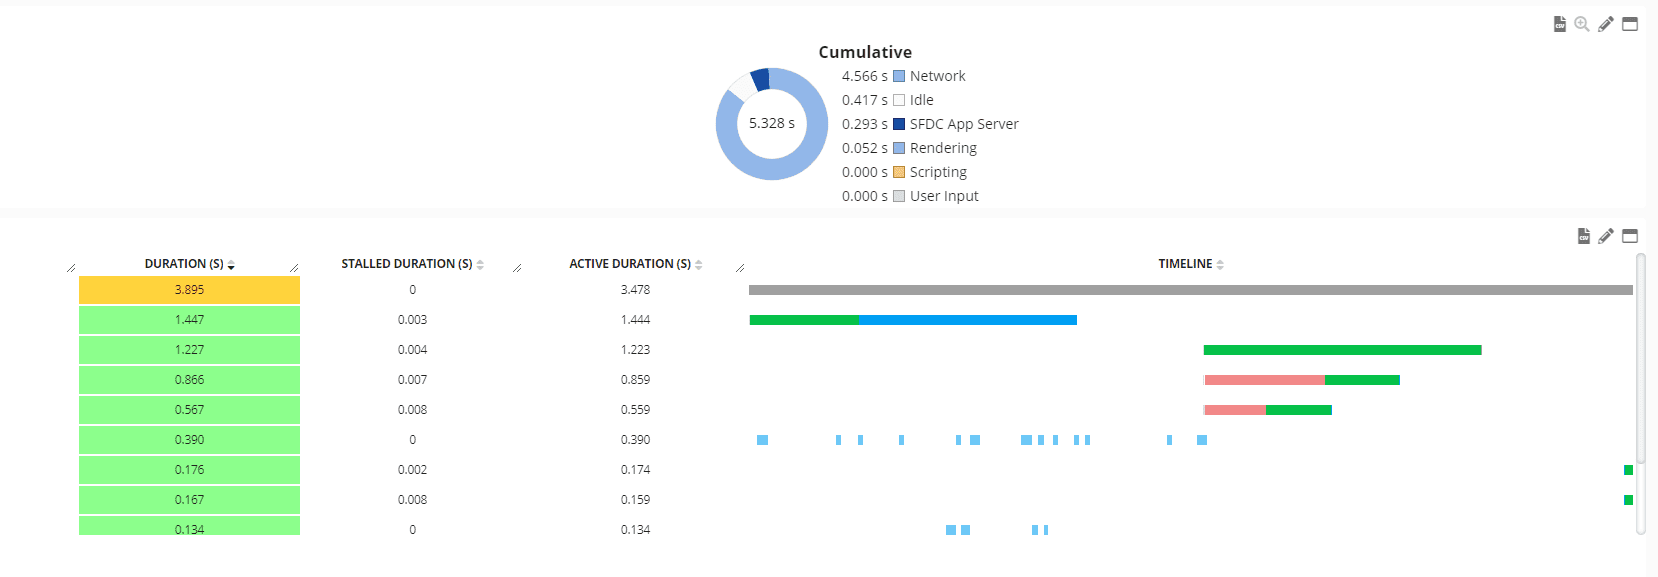
ReactJS app (High-level Transaction Duration Breakdown for a ReactJS app using germainAPM’s js):
Salesforce.com saas solution (High-level Transaction Duration Breakdown for a Salesforce.com app using germainAPM’s js):
Deep dive into javascript (using germainAPM’s browser extension)
and some insights on whether this is stall, connection, wait, download ,etc
Supported Technologies
- Any Web App (Html, AngularJS, ReactJS, VueJS, etc)
- Any Device (desktop, mobile, etc)
Reminder:
That end-to-end analysis of a user click or transaction, is configurable, so you can further define data relationship and can include any data sources e.g. this above RCA dashboard can include any transaction from the ones executed in the Browser (javascript, etc), Network (http, etc), Back-end Applications (web server, application code, database SQL, CTI, etc), making very handy to understand the end-to-end executions of a user click or complex transaction.
For light analysis of page performance, with time broken down by layers
For advanced analysis of page performance down to the line of Javascript


