The 6 Best Real User Monitoring Tools (2020 comparison)

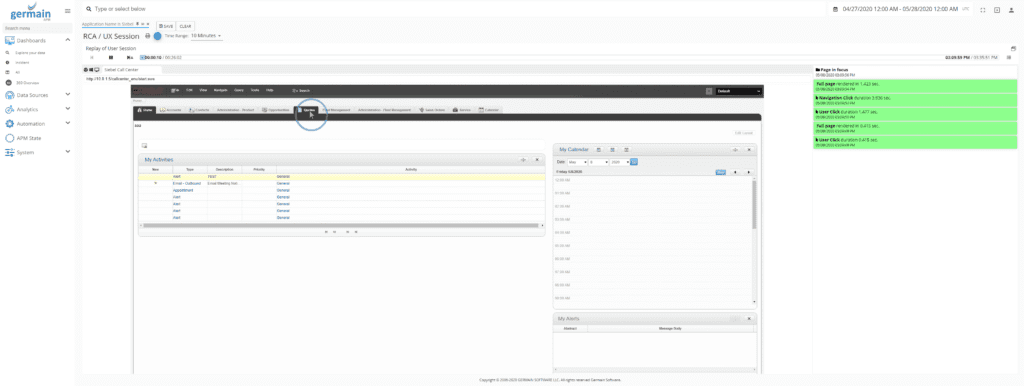
Modern user interfaces and exceptional employees aren’t just enough to deliver optimal DX/Digital Experience. Mission-critical technologies that perform well, easy to use, exceptional interaction with every touchpoint of an organization. Operational excellence has become more challenging as it relies on more complex infrastructure and technologies, and users with different background and experience, and an ever […]
Apache SolR vs ElasticSearch
Result of an internal pilot of Apache SolR and ElasticSearch, with regards to Indexing and Searching. We performed that pilot 1.5 years ago..but several asked for this so sharing it on this blog. hope this helps..feel free to reach out to us if you need more details. Pilot Result Index Speed based on 100 million […]
Creating The Ultimate UX Isn’t Magic: It’s Real-Time Metrics and Automation
Creating The Ultimate UX Isn’t Magic: It’s Real-Time Metrics and Automation (and, which we don’t cover here, but equally if not more important, an organization that effectively executes to leverage these metrics and complement these automation) What’s the magic formula for attracting customers, keeping them attracted, convincing them to recommend your company to their peers, […]
Reduce User Frustration with Mobile Phones & Tablets
Mobile devices have long replaced desktops, and user issues have simply moved over to these mobile devices, and a phone or system upgrade won’t just always be the solution to these user frustrations. germainAPM can significantly help reduce these user issues by proactively monitoring performance and user experience of these users on their mobile phones, […]
Debug Javascript (in real-time)

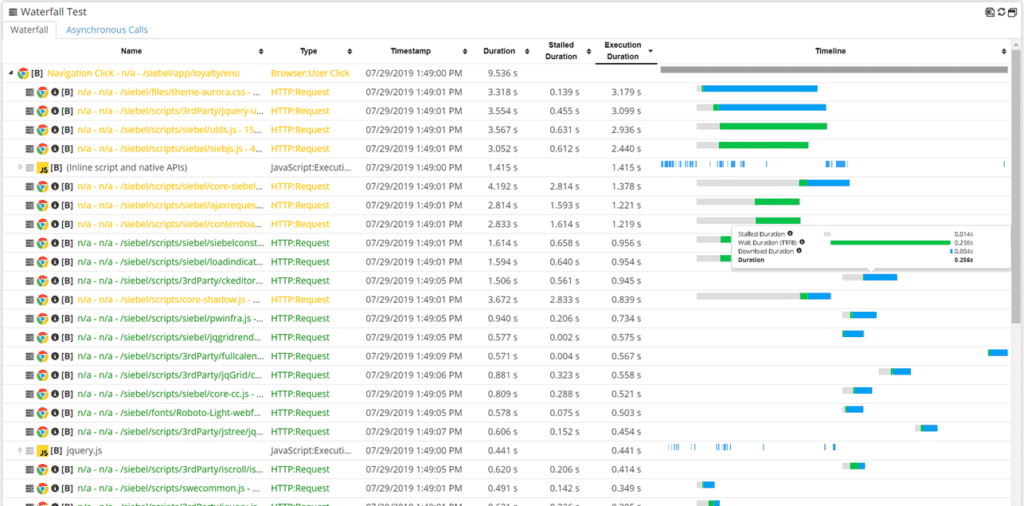
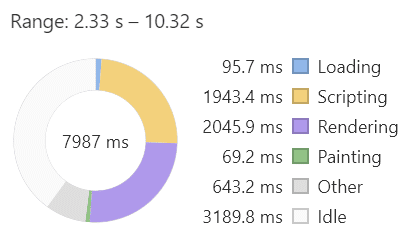
Real-time performance monitoring and analysis of Javascript execution, down to the line of code, for any web application built with any javascript framework (AngularJS, ReactJS, VueJS, etc). That feature completes the end-to-end time breakdown of a user click (>java script>network request>web request>application code>database sql,…levels and any integration layers) Metrics Any metric that Google Chrome provides, […]
Measuring the Real-time Performance of a Web Application Using Only JavaScript

cross-browser, no extensions or other installation, no interruption of end-user’s experience Built-in Profilers The profiling functionality offered in most web browsers can be used to understand where the largest performance bottlenecks are, but they have to be triggered by the end user and therefore that data will only be available to those with access to […]
6 tips on how to monitor your javascript application

When it comes to troubleshooting user issues (experienced with your web apps), you have the option to ask your end-users to use Google Chrome Developer console and get more details on javascript execution/failure, static content loading issue, network disconnectivity, etc. (with the issue that this Google Chrome console is NOT going to pinpoint issues that […]
Cost of application downtime

The real cost of downtime Schedule A Free Demo
APM Predictions: 7 bad things that may happen to your mission-critical business applications
Are you ready to hit the ground running with your Application Performance Management resolutions? We certainly are. To better prepare, we asked our experts what they saw in the field last year, and decided to bring you the worst of it. We sincerely hope none of these will happen to you. Unfortunately they probably will… […]
MTTI, MTTR, how to get these numbers down
Mean Time to Identify (MTTI) refers to the time it takes to detect an incident (incident that affect your users, business processes and/or technologies performance) and identify its root-cause.Mean Time to Resolve (MTTR) is the average time between the start and resolution of that incident.Business needs are evolving significantly more quickly than before, causing more […]
